**Dogecoin’s 200 EMA Support and Its Role in the Current Bull Phase**
Dogecoin has tested its 200 EMA (Exponential Moving Average) multiple times during the current cycle, with each rebound reinforcing the ongoing bull phase. These repeated tests have occurred within rising channel patterns, highlighting the cryptocurrency’s resilience on broader timeframes such as 3-day and weekly charts.
The 200 EMA, calculated over 200 periods on weekly charts, serves as a critical long-term support level. Analysts note that this moving average acts as a momentum reset point during price corrections, preventing deeper declines and sustaining higher highs and lows within the bull structure.
—
**How Has Buff Doge Coin Performed Amid Dogecoin’s Market Reset?**
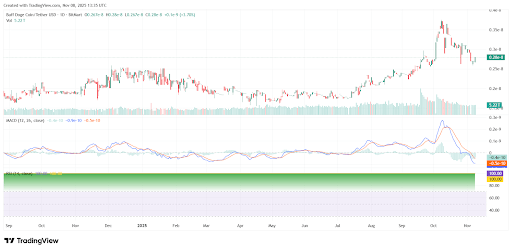
Buff Doge Coin, paired with Tether, experienced a prolonged consolidation phase in early 2025 before breaking out in June. The token surged from 0.27e-8 to a peak of 0.35e-8 by August, reflecting strong market participation according to Crypto Rank data.
Following this rally, Buff Doge Coin underwent a correction, retracing to 0.26e-8 by November. Technical indicators like the MACD showed bullish momentum turning neutral with a downward crossover, while RSI readings near 100 signaled easing overbought conditions without a loss of volume support.
Experts emphasize that such corrections are typical in the volatile meme coin market, creating potential accumulation opportunities for traders.
—
**Dogecoin’s Price Action and Moving Average Trends**
Dogecoin itself mirrors these dynamics, having stabilized around $0.177 after declines from highs near $0.29. Historically, in years like 2021 and 2023, Dogecoin formed lower highs and lows in the $0.05 to $0.06 range, building a base which supported the 2024 breakout into an upward channel.
By mid-2025, peaks approached higher targets before retracing, with the 200 EMA consistently providing a reliable floor during pullbacks. Analyst Kevin points out that this level sits mid-channel and frequently flips between support and resistance, underscoring its importance in the ongoing bull structure.
Resistance levels loom at $0.95 to $1.30 and $2.30 to $3.00—remnants of past cycles that could cap further upside if not decisively breached.
—
**Moving Average Signals and Market Sentiment**
Santiment’s daily charts revealed a bearish crossover in October, where the 50-day moving average dipped below the 200-day following a rebound from $0.16 to $0.29 between May and September.
The current downward slope near $0.177 points to sustained selling pressure, though short-term bounces suggest accumulation is still active. Traders are watching these indicators closely; a sustained hold above the 200 EMA could propel Dogecoin towards renewed highs, while a break below may extend the ongoing correction.
Volume data from Santiment indicate consistent trading activity during these shifts, suggesting engaged market participants rather than outright capitulation.
—
### Frequently Asked Questions
**What Does Dogecoin’s Rebound from the 200 EMA Mean for 2025 Traders?**
Dogecoin’s repeated rebounds from the 200 EMA in 2025 strengthen the bullish channel, supporting higher lows and ongoing accumulation. Analyst Kevin suggests that if momentum resets positively, Dogecoin could target resistance zones between $0.95 and $1.30. Traders should look for volume spikes to confirm the uptrend continuation.
**How Is Buff Doge Coin’s Correction Related to Dogecoin’s Moving Average Trends?**
Buff Doge Coin’s mid-2025 correction from 0.35e-8 to 0.26e-8 aligns with Dogecoin’s bearish moving average crossover, both reflecting a post-rally cooldown phase. Indicators like RSI and MACD suggest these are temporary pauses, offering potential rebound opportunities in the respective tokens.
—
### Key Takeaways
– **Dogecoin 200 EMA Resilience:** Multiple tests during the bull cycle confirm strong support, facilitating higher highs and lows.
– **Buff Doge Coin Surge and Pullback:** The June-August rally to 0.35e-8 was followed by a correction to 0.26e-8 in November, with supporting high RSI levels near 100.
– **Moving Averages Signal Caution:** Bearish alignment of the 50-day and 200-day averages at approximately $0.177 signals ongoing selling pressure but also hints at possible accumulation phases.
—
### Conclusion
Dogecoin’s steadfast 200 EMA support and Buff Doge Coin’s technical adjustments reflect a market in a state of reset amid the 2025 bull phase. While moving averages highlight some pressures, the overall structure remains navigable with higher support levels intact.
Investors and traders are encouraged to closely monitor volume trends and EMA interactions, positioning themselves for potential breakouts toward significant resistance zones in this evolving crypto landscape.
Stay ahead of the market reset—track these key levels and moving average signals for informed crypto strategies today.
https://bitcoinethereumnews.com/tech/dogecoin-rebounds-from-200-ema-support-suggesting-possible-bullish-momentum/