**Ethereum Rebounds from $3.2K Region, Signaling Potential Trend Exhaustion**
Ethereum (ETH) has bounced back decisively from the $3,000–$3,200 demand zone after a deep liquidity sweep, indicating a possible exhaustion of the recent downtrend. While short-term resistance remains significant, both technical and on-chain data suggest that the market may be entering an accumulation phase led by larger participants.
—
### Technical Analysis
*By Shayan*
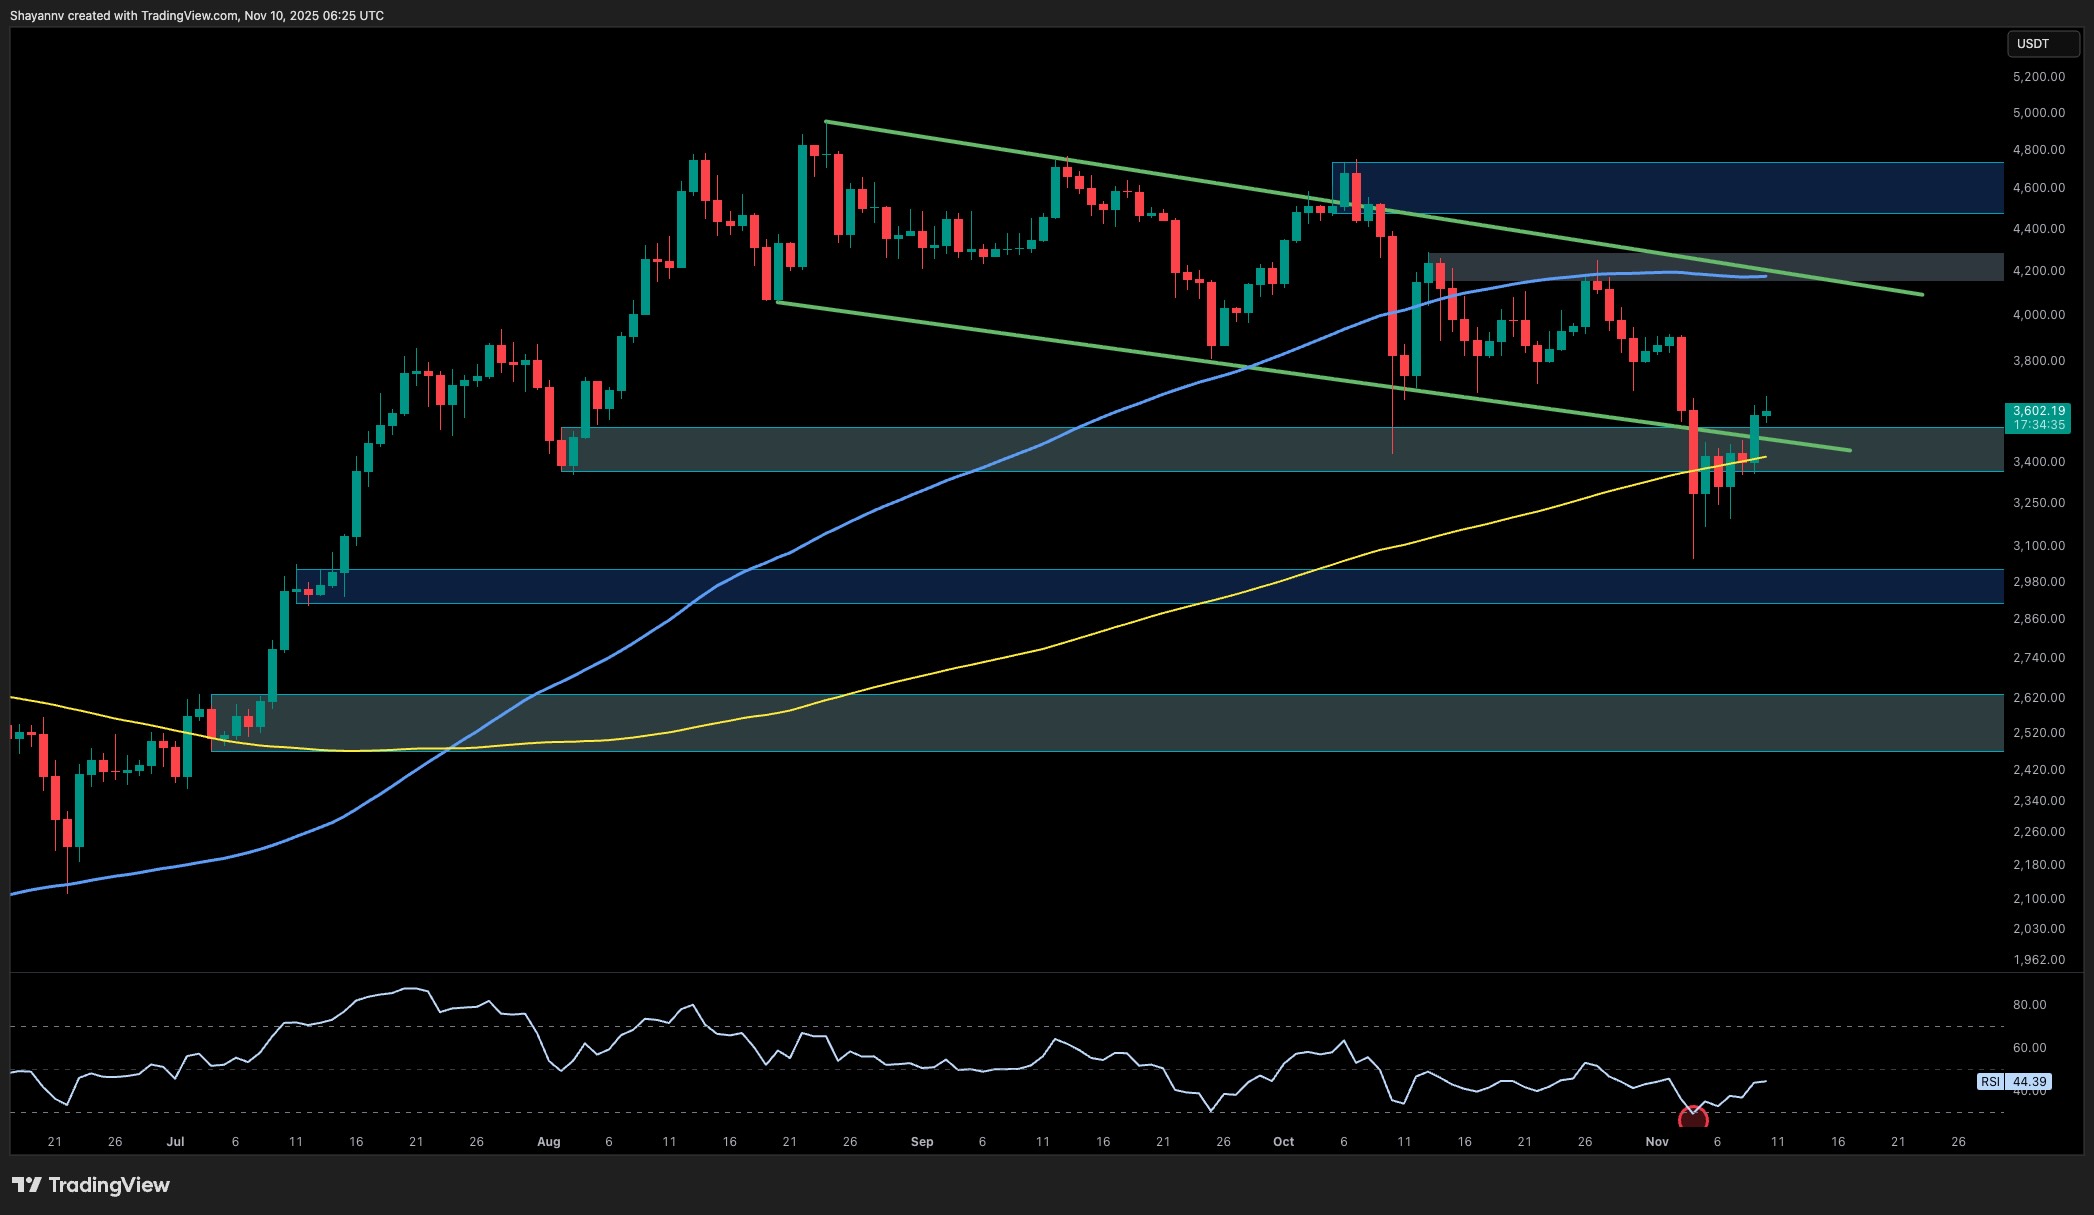
**The Daily Chart**
On the daily timeframe, ETH found strong support in the $3,000–$3,200 region, which aligns with the lower trendline of the descending channel and the 200-day moving average (MA). This confluence zone acted as a robust reaction base, forming a long lower wick—a clear sign of liquidity absorption by stronger hands.
The recent attempt to break out from the descending parallel channel marks the first constructive signal since mid-October. Currently, Ethereum is retesting the $3,600–$3,700 resistance cluster, an area defined by the intersection of the channel’s midline and a key institutional decision point.
If buyers can close above this resistance range, it would confirm a structural shift in the market. This could pave the way for a continuation move toward the $3,900–$4,000 level, with a potential further target near the high-liquidity zone around $4,400.
However, failure to sustain above $3,600 may lead to a short-term retest of the primary support zone near $3,000.
—
**The 4-Hour Chart**
Zooming in, the 4-hour chart reveals a classic bear trap setup. After an aggressive breakdown below $3,300, Ethereum briefly dipped into the $3,000 liquidity pocket, sweeping the lows of the descending channel before sharply reversing upward.
This quick recovery invalidated the bearish momentum and triggered a short-term reversal phase. Currently, price action is consolidating just below the $3,600–$3,700 “Seller’s Base,” which represents the last significant supply zone established before the previous decline.
A clean breakout and retest of this seller’s base would likely confirm that buyers have regained control. Until then, ETH is expected to fluctuate between $3,400 and $3,700, building its structure ahead of the next expansion leg.
The Relative Strength Index (RSI) supports this outlook, having broken out of a multi-week bearish divergence and now climbing steadily. This suggests there is room for further recovery, provided the structure holds.
—
### Sentiment Analysis
*By Shayan*
The Spot Average Order Size metric for Ethereum points to a notable behavioral shift after the recent market shakeout. During the drop toward $3,200, whale-driven activity (indicated by green clusters) spiked briefly—a pattern historically associated with local bottoms and early accumulation phases.
This signals that larger market participants are taking advantage of discounted prices to re-enter exposure, while retail traders remain cautious.
In previous market cycles, such transitions—from whale accumulation to retail capitulation—have often marked the beginning of trend reversals or the late-stage compression phases before major uptrends.
If this trend continues and the $3,000–$3,400 region holds as solid structural support, Ethereum may be entering a low-volatility accumulation zone. This setup could lead to a final bullish impulse toward the upper resistance range of $4,500–$4,800.
—
**In Summary:**
Ethereum’s recent price action, combined with technical indicators and on-chain whale activity, suggests a potential shift from the recent downtrend into an accumulation phase. Key resistance at $3,600–$3,700 will be decisive for the next bullish move, with important support at $3,000 setting the stage for a possible rally toward $4,500 and above.
https://cryptopotato.com/ethereum-price-analysis-key-resistance-still-stands-between-eth-and-4k/